Struct
HackGT project to help visualize codebases (2017)

Inspiration
In any team-based project, whether it be open source or for a company, it is important for new members to quickly understand what has been done and what needs to be done. But if the codebase is extremely large, it can take people weeks to understand the full structure of the application. Struct was created to help onboard new project team members by automatically illustrating the structure of a codebase in a simple and intuitive fashion.
What it does
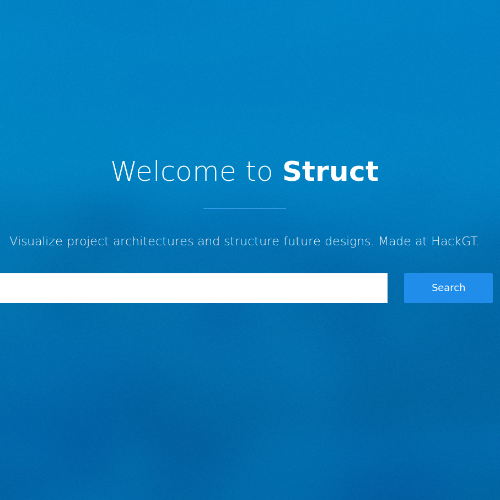
Struct is a code visualization web app that generates and displays a graph representation for any given GitHub repository. The graph displays each file as a node and links nodes together by finding related objects (e.g. classes, methods) in each file. The user can also manually tag and move nodes around to better organize the graph.
How we built it
The user first enters the URL of the GitHub repository they want to parse. The URL is sent to the Python Flask server, where the files on the repository are scraped recursively. The server then processes all the code files to identify key elements (e.g. classes and methods) and how these elements are used in other files. This information is applied to generate a graph representation of the codebase which is displayed on the front-end using D3.js.
Challenges we ran into
Determining which files were related within a codebase was the toughest part of the project. To accomplish this, we had to construct simplified interpreters to parse out important symbols (e.g. classes and functions) from project code files while following language-specific syntax rules. Matching symbols were then used to infer dependencies from one file to another, forming the edges of the graph.
What’s next for Struct
We plan on better organizing the graph structure that is displayed so that edges do not overlap and adjacent nodes are close together. In addition, we would like to support more languages and improve on our parsing algorithm. Lastly, additional functionality such as an access frequency heatmap or the ability to generate different views of the graph to better suit specific roles would greatly improve our application.